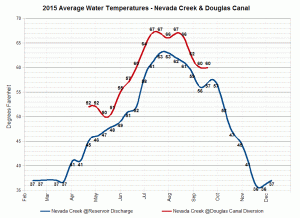
2015 Water Temps
Water temperatures have been a point of discussion at times concerning their effects on irrigating crops and also fisheries. I thought that it might be of interest to some to be able to view the actual changing water temperatures that I routinely measure throughout the season.
I have gone back through my flow measurements (which also record water temperature) for the calendar year 2015 and performed a 10 day rolling average for the two most frequently measured sites on the Nevada creek system. These two locations are at the Nevada creek gage site just downstream of the Nevada Creek Dam discharge outlet, and the Douglas Creek Canal diversion on Nevada creek.
Graph Below
(click image to enlarge)
Multiple other sites are also measured, but not always at the frequency to provide for a good chart. If anyone is interested in data at other sites, contact me and I will provide what I have.
